

Data Shows Corporate America Is Heavily Concentrated Around 3 States
The geographic map of corporate America remains anchored by a powerful few, but the race for economic dominance is…
Read article →
The 20 Biggest Media Companies in The World
Looking at the world’s largest media companies helps us understand who controls the news, movies, and the online…
Read article →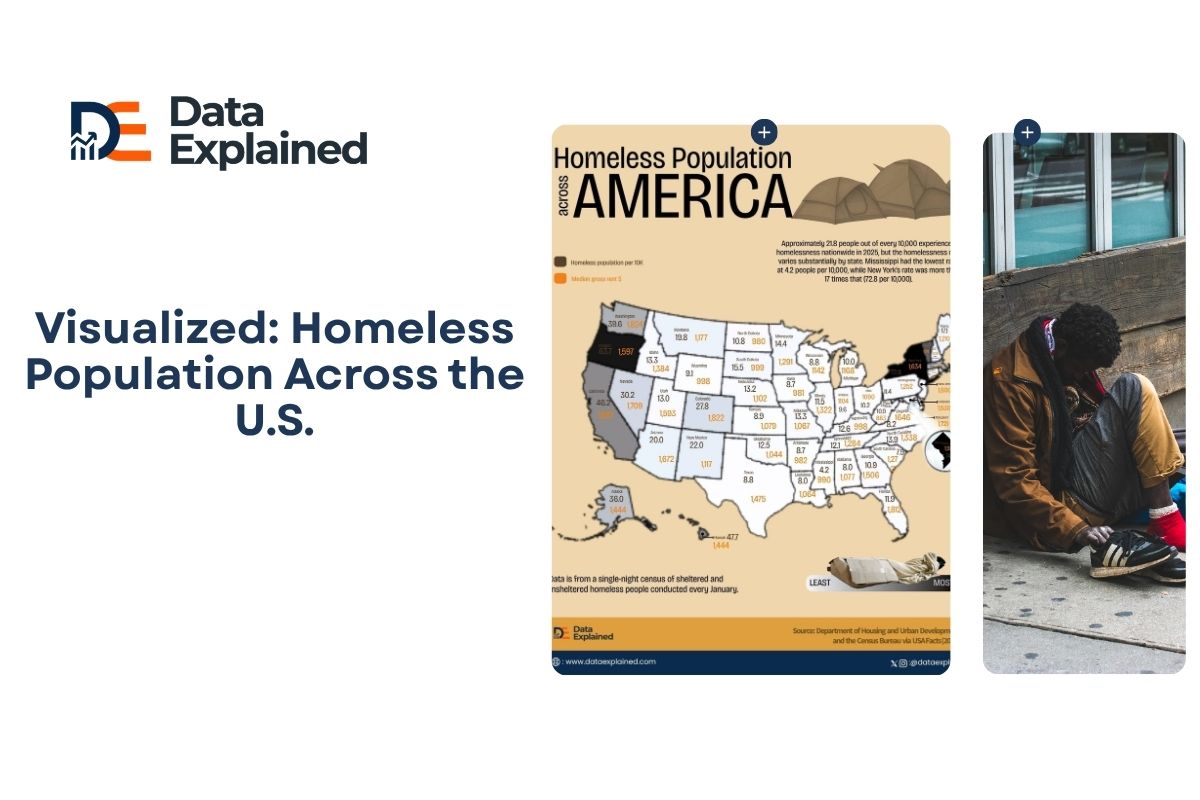
New York’s Homelessness Rate Is 17 Times Mississippi’s
New York’s homelessness rate sits at 72.8 people per 10,000 residents. Mississippi’s sits at 4.2. The visualization…
Read article →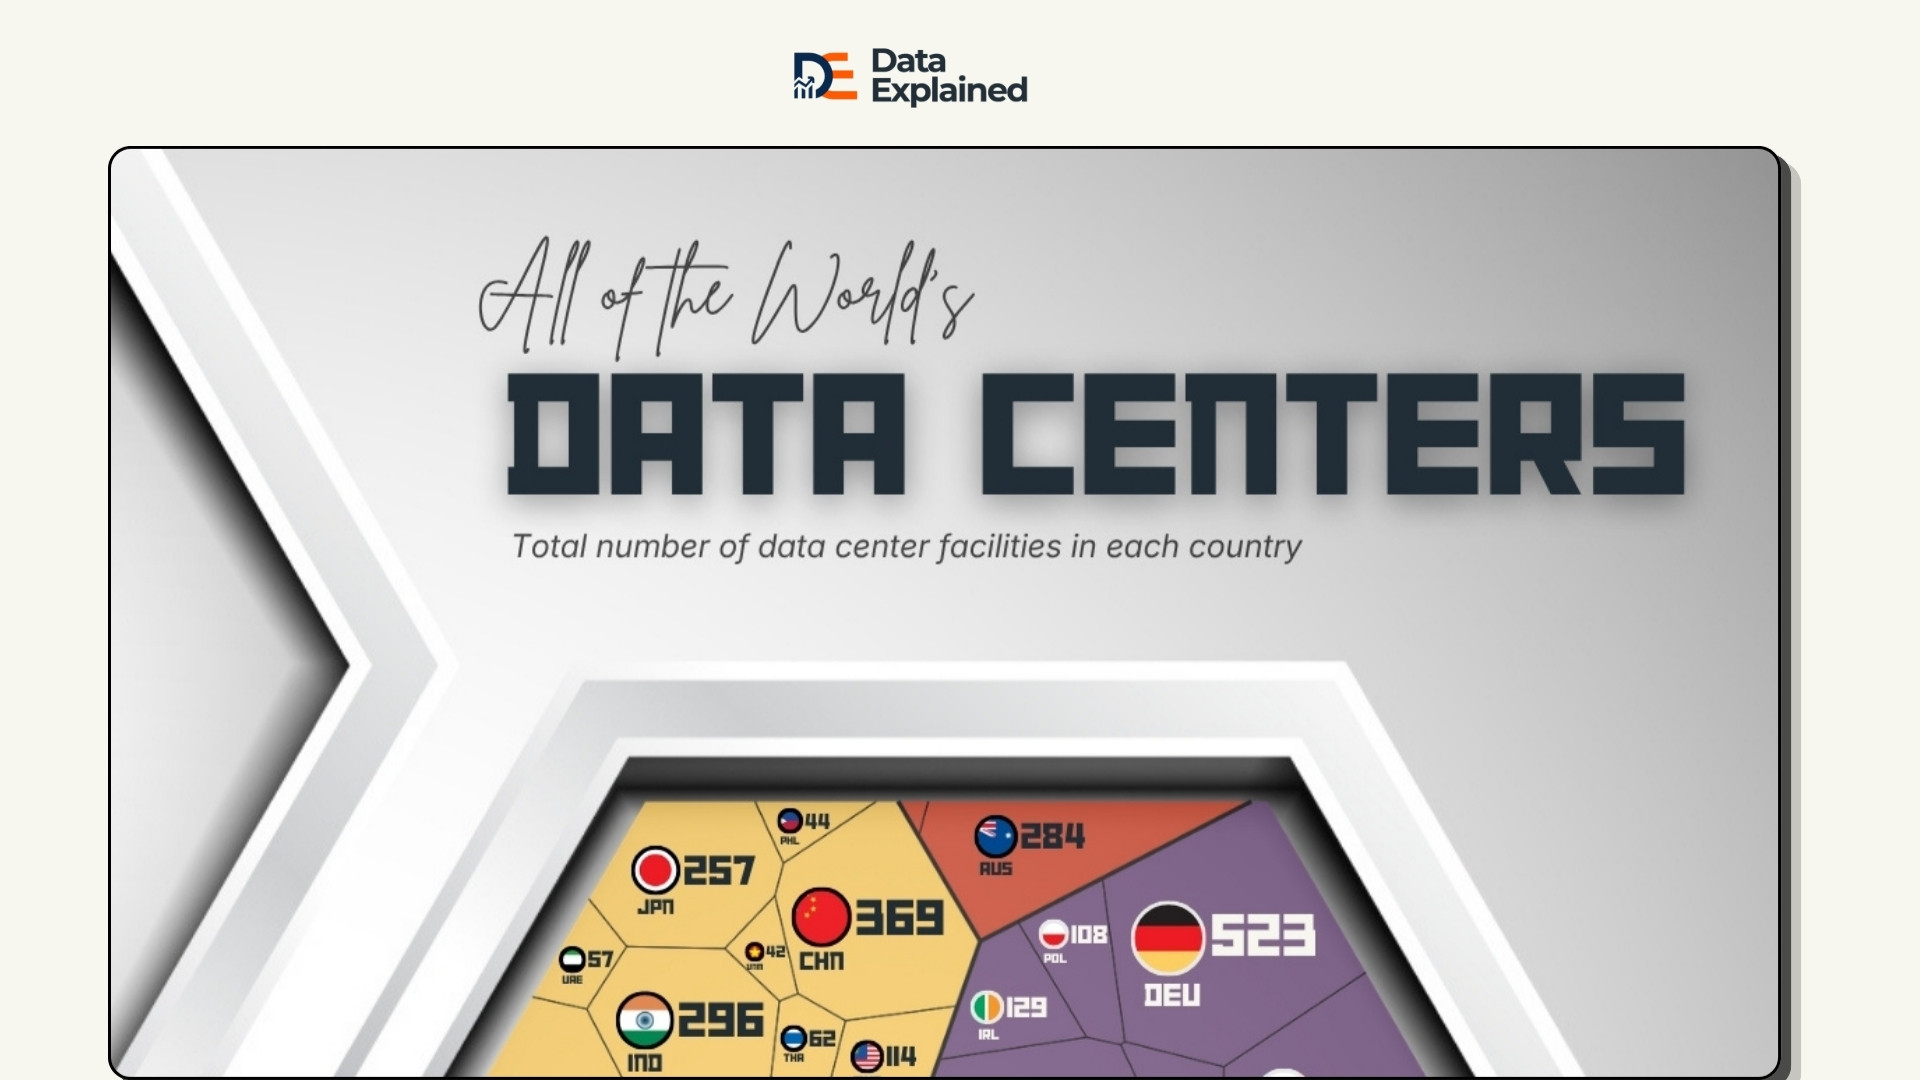
China Has 369 Data Centers; America has 4,423. Who is Winning the AI Race?
Data centers are facilities designed to store and compute vast amounts of data efficiently and securely. The global data…
Read article →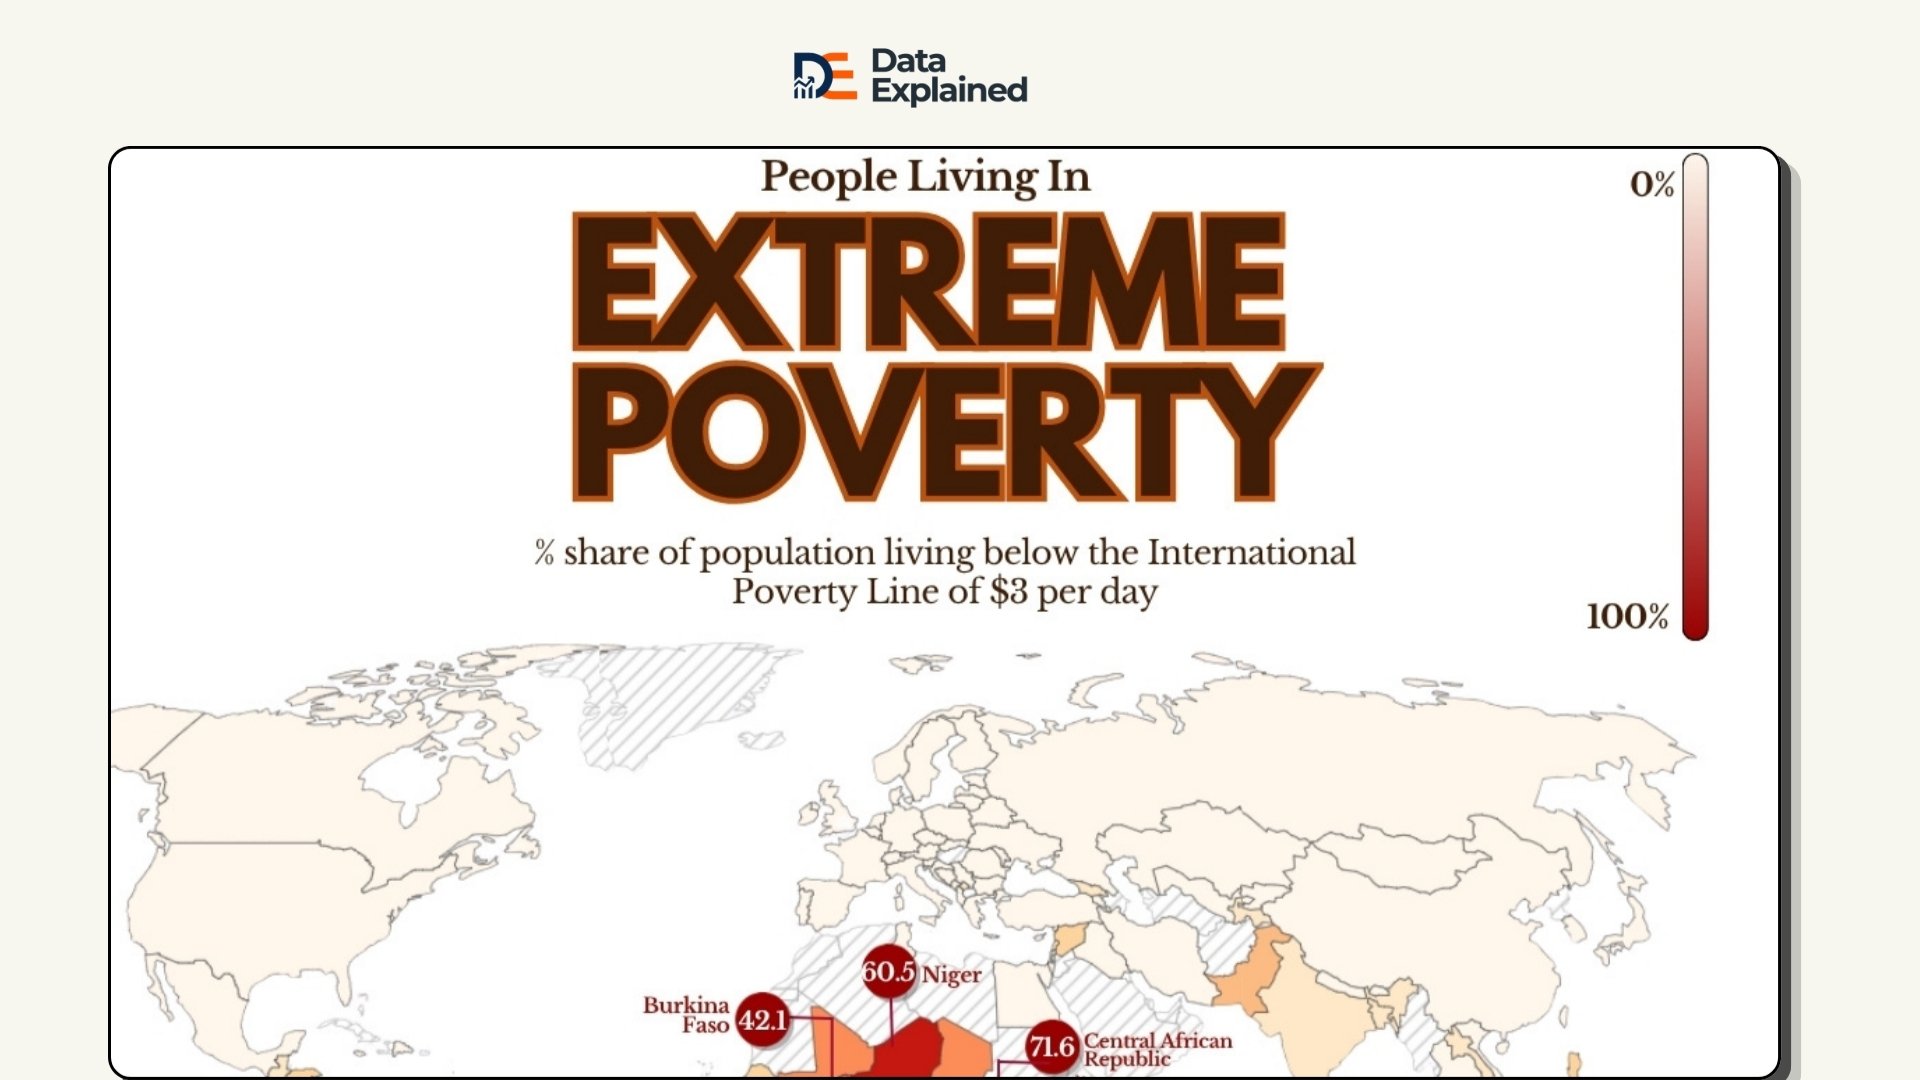
85% of People in DR Congo Live on Less Than $3 Daily
Every country where more than 20% of the population lives on less than $3 a day is in Sub-Saharan Africa. The Democratic…
Read article →
Visualized: Worst States to Retire in The U.S.
Florida and Virginia rank as the two least-bad entries on a list of America’s worst states to retire in. This is…
Read article →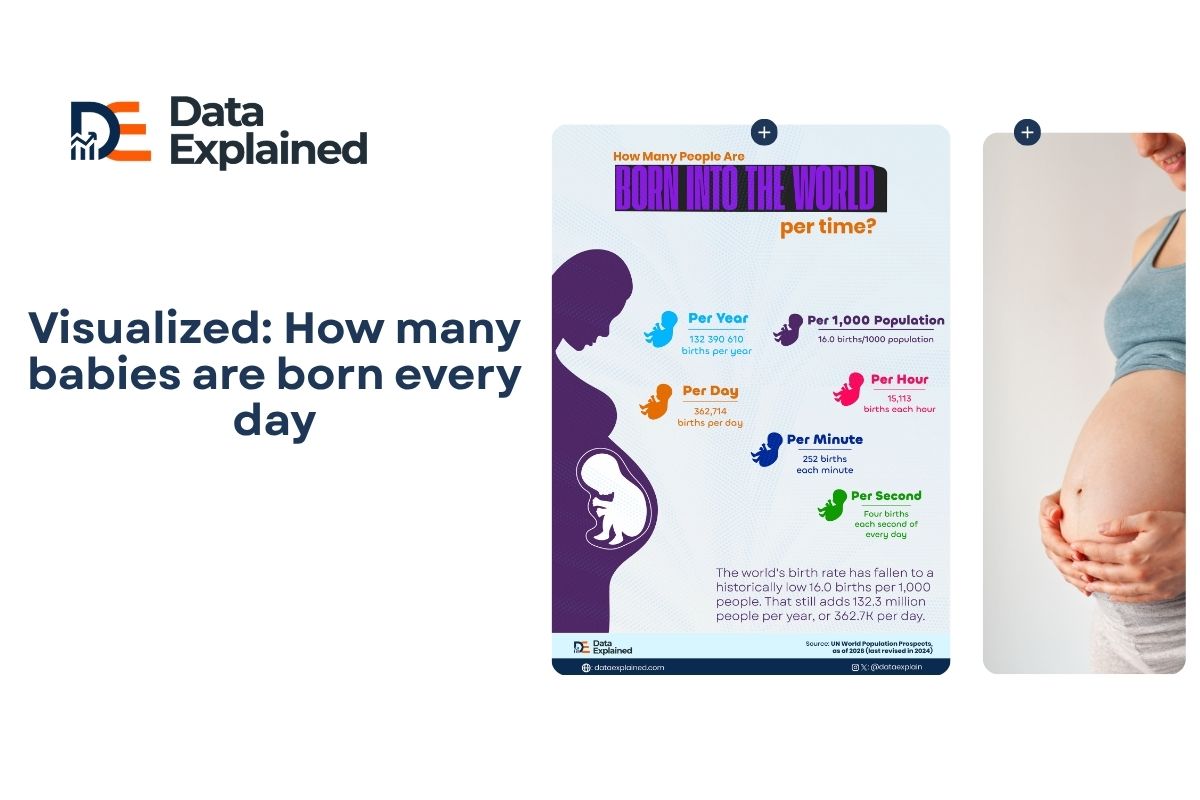
As Global Birth Rate Falls, 362,000 People Are Born Daily
A falling global birth rate still adds 362,714 people to the world every single day. The global rate is 16.0 births…
Read article →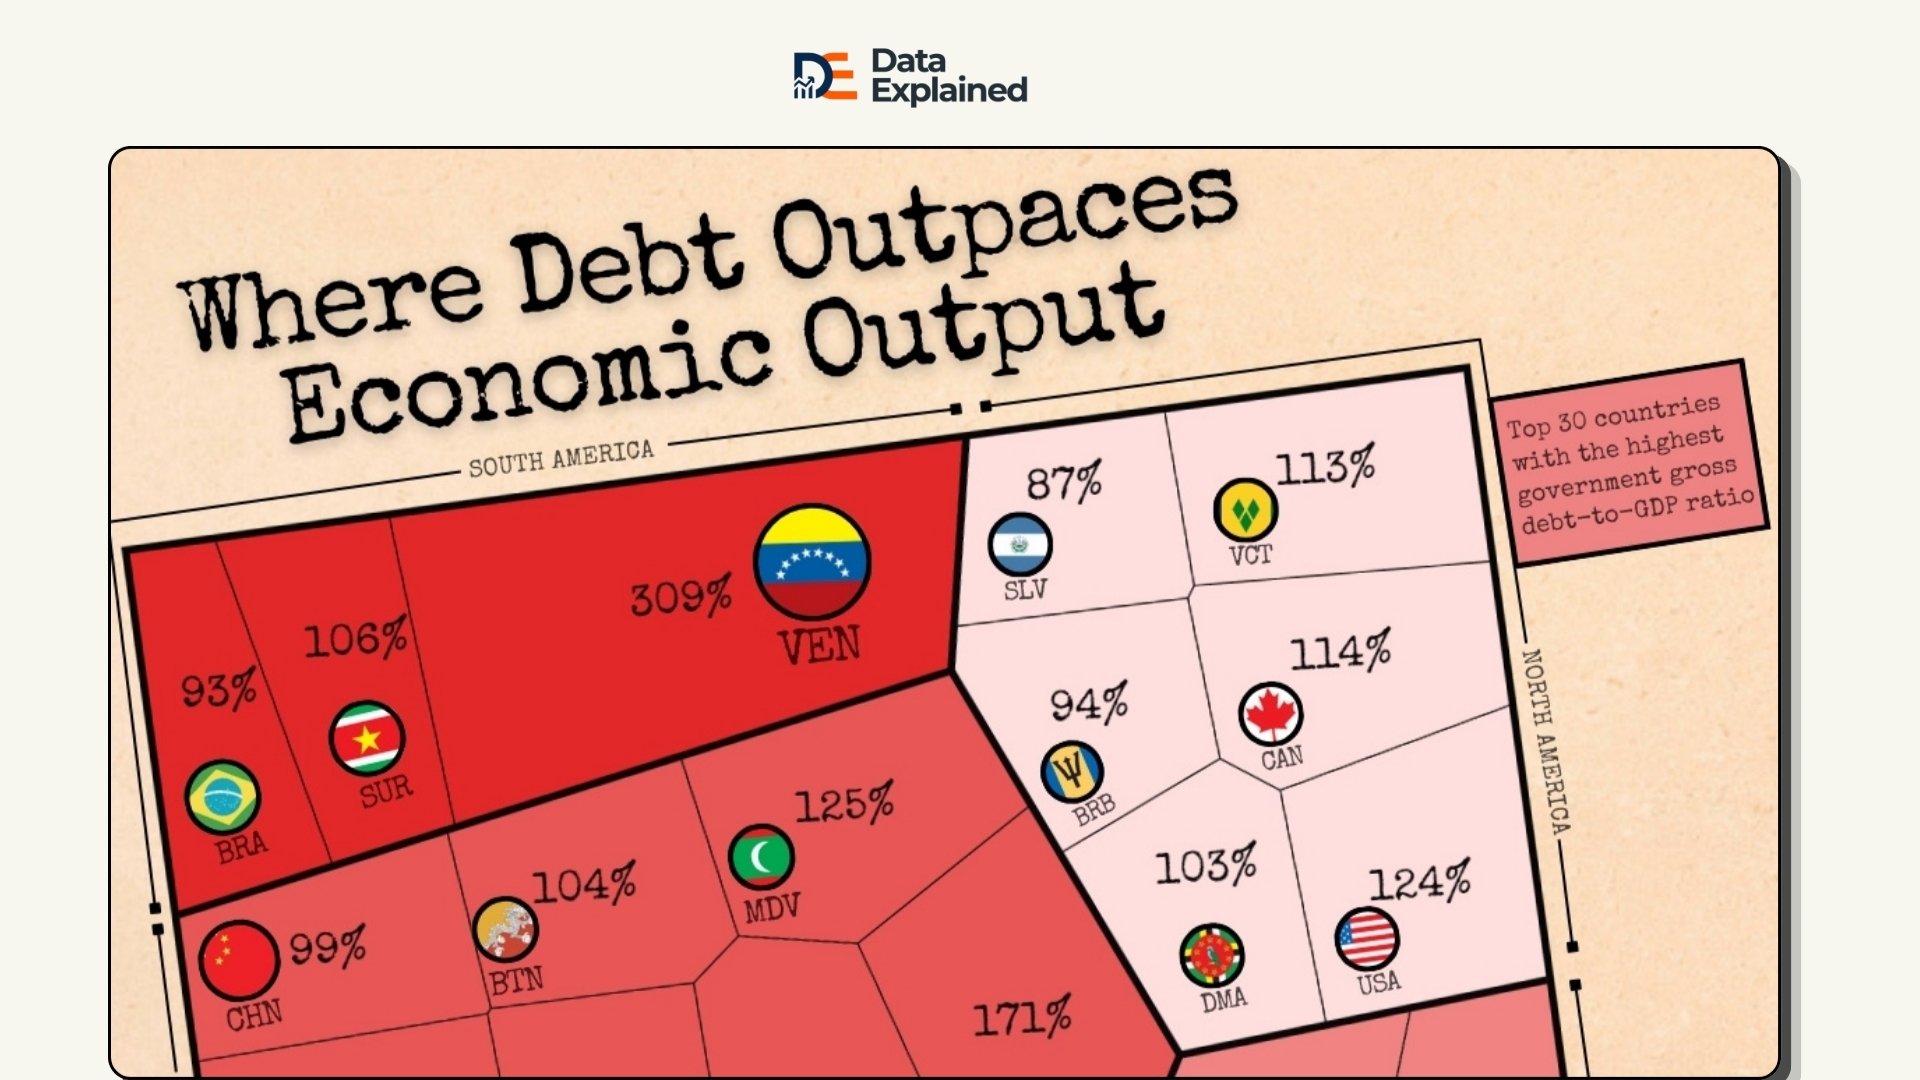
World’s Biggest Economies Are Drowning In Debt, IMF Data Shows How Deep
The debt-to-GDP ratio compares a country’s total public debt to its yearly economic output (Gross Domestic Product).…
Read article →